When you have too many factors competing for your attention, we often get confused to determine which factors to focus on priority. Pareto chart will help us to prioritize the most important factors to focus first. Which brings up the question. What is a Pareto Chart?
Pareto chart or Pareto principle is invented by Vilfredo Pareto, a noted Italian economist, engineer and socialist. Pareto principle was named after him.
What-is-Pareto-Chart
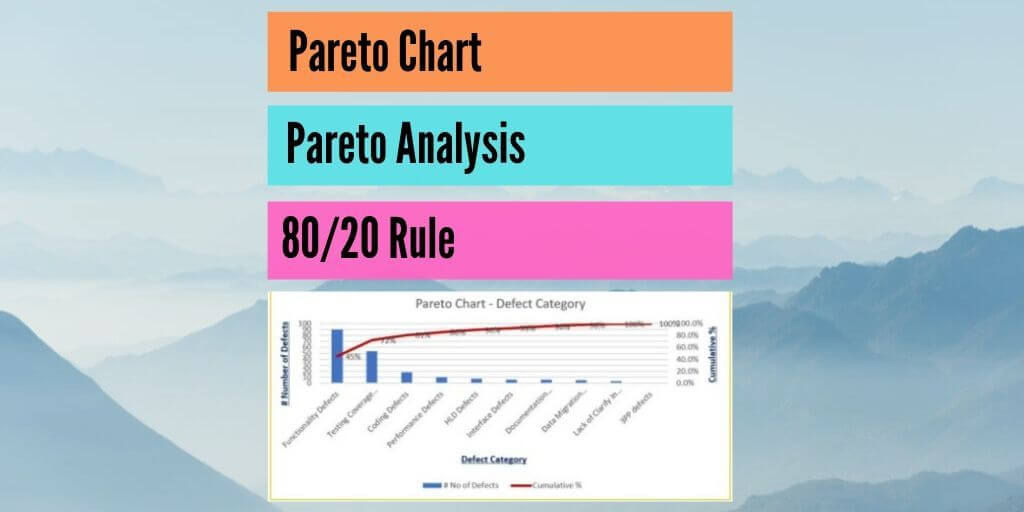
What Is A Pareto Chart?
- Pareto chart is a graphical representation of Pareto analysis. Pareto analysis is also called as Pareto principle or 80 20 rule.
- Pareto chart is type of chart with combination of bar graph and line graph. Pareto chart has two vertical axis and one horizontal axis.
- Individual causes or factors organized horizontally on X-Axis in the descending order.
- Frequency of occurrence of causes, organized vertically on Y-Axis at left side.
- Cumulative % of individual causes or factors, are represented on Y-Axis at right side.
- Bar graph is used to represent the individual values in the descending order. And cumulative % values are represented using a line chart.
- Once plotted the graphs, mark the line graph for 80% of cumulative %, and you see how many individual factors are going to give you the approximately 80% of the benefit. This means that, if you put more focus on these finite (roughly 20%) number of factors, you will be able yield maximum (approximately 80%) of benefit.
What Is A Pareto Chart Used For?
- Pareto chart is a formal technique useful to focus on the most important factors, when multiple factors are competing for your attention.
- Pareto chart helps to estimate and choose a number of most effective factors that deliver reasonably close to the maximum possible benefit.
- Pareto chart helps to identify the top portion of causes that resolves majority of the problems. Once the important causes are identified, then root causes of these problems can be identified using Ishikawa diagram or fish-bone analysis.
- Pareto Chart or Pareto Analysis is also called as 80 20 rule. The 80 20 rule says that nearly 80% of the problems are caused by approximately 20% of the causes.
- This 80 and 20 should be considered as an approximate ratio. It needs to be understood as majority of the problems (~ 80%) are caused by less number (~20%) of causes. Tilt symbol (~) is used here to convey that these numbers are an approximate value and should not be considered as the actual values.
80 20 Rule – Vital Few and Trivial Many
- 80 20 rule states that majority of the factors are due to the less % of causes. It is explained with two terms called “Vital Few” and “Trivial Many”.
- Vital Few – is the top 20% of the causes that is triggering the 80% of factors
- Trivial Many – are the bottom 80% of the causes.
- Here we are not talking about just issues. Pareto Chart or Pareto principle can be applied even to positive things. Its main objective is to find out the most beneficial factors to focus on.
Steps to Make a Pareto Charts
In order to understand Pareto chart, let us take an example of software project. In the software project,
- First thing first. We need data to analyze using Pareto chart, as mentioned below.
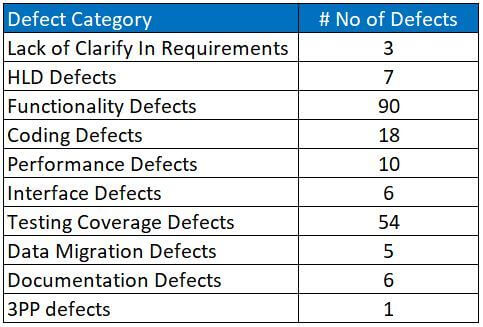
Pareto Chart Example Software Defects And Factors Data
Defect category indicate the individual factors. And Number of defects are quantifying indicates the defects found in an example software project for each defect category.
- Let us arrange them in the descending order of number of defects.
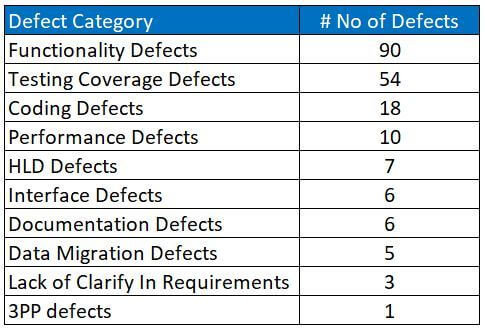
Pareto-Chart-Example-Software-Defects-Factors-Descending-Order
- Insert a column to calculate Cumulative total % of the values from the above step.
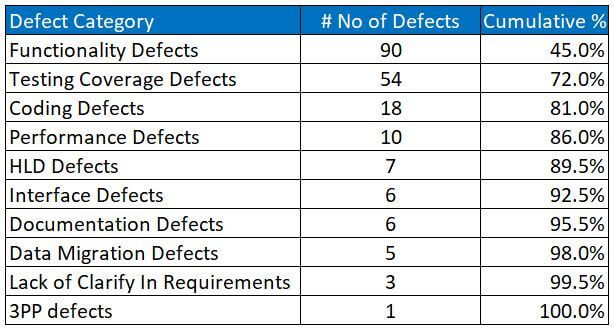
Total number of defects here is 200. First value is 90, which is 45% of 200.
Second value 54 is the 27% of 200. Cumulative % of second value is sum of 45% and 27%, which is 72%.
Likewise calculate cumulative % for all the rows in the table.
Insert a column to calculate Cumulative total % of the values from the above step.
- Draw a Pareto chart as follows:
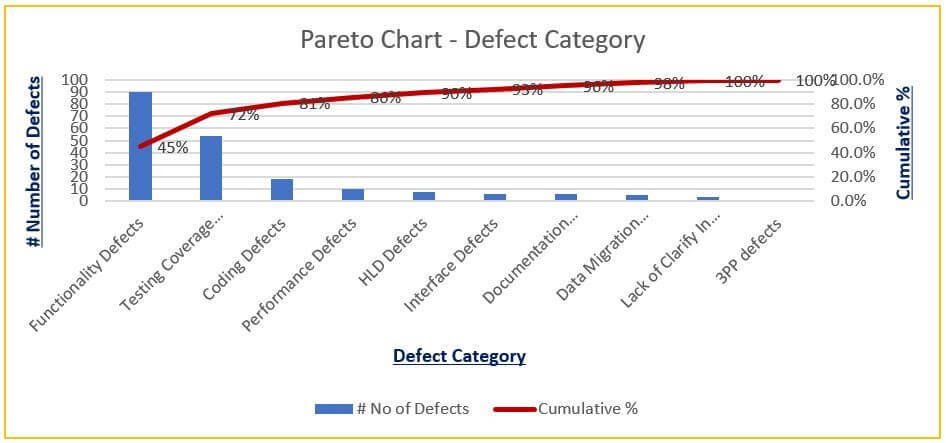
- If you observe the above Pareto chart, if you focus more on Functionality, Testing Coverage and Codding Defects, you can resolve approximately 80% of the defects. If you cover only the functionality and testing coverage defects, it resolves approximately 70% of defects.
How to Make A Pareto Chart In Excel?
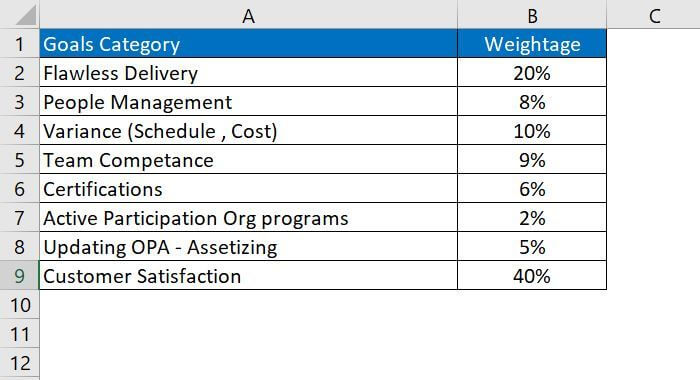
Let us take another example to make the Pareto chart in excel. In this example we will prioritize the goals important for you to successful in the current role as a manager.
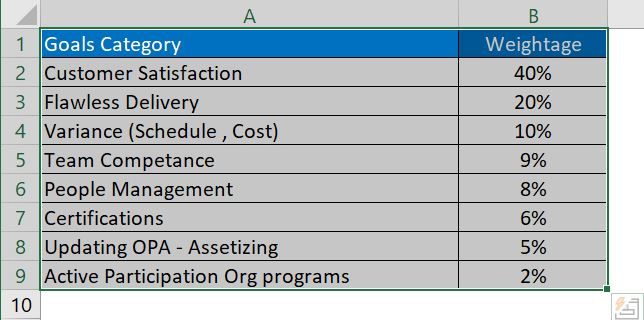
- Keep the data of goals and weightage for each goal.

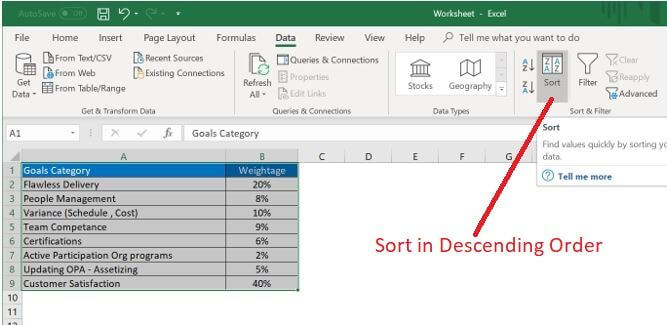
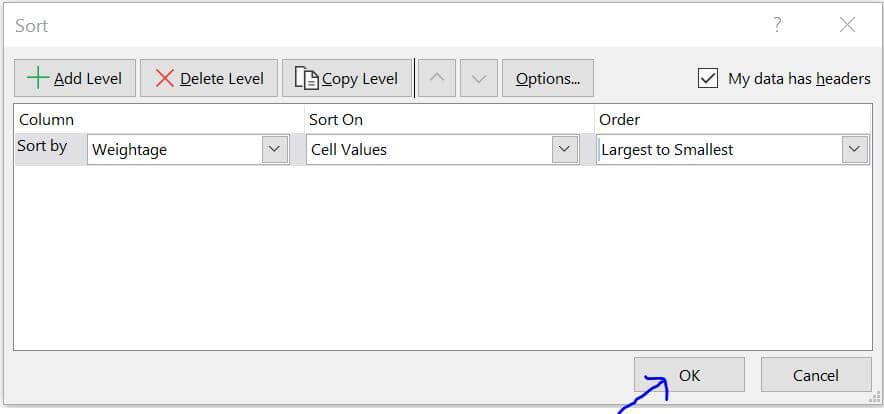
- Select the above data from A1 to B9 and click on the sort option.
- Select weightage column and order as “Largest and Smallest”
- After sorting, the tables looks as follows:
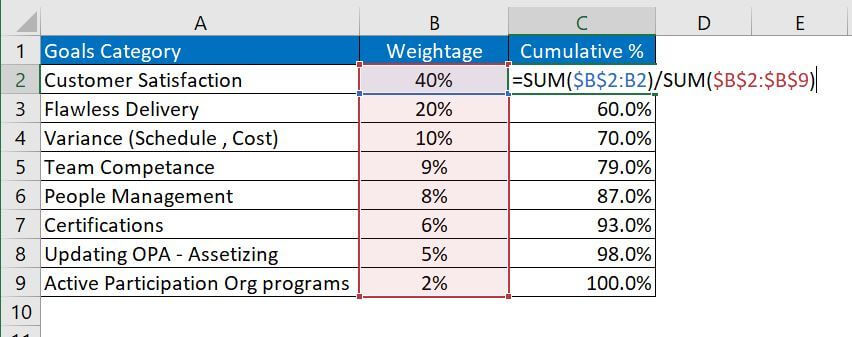
- Insert another column for calculating Cumulative % of weightage as mentioned below.
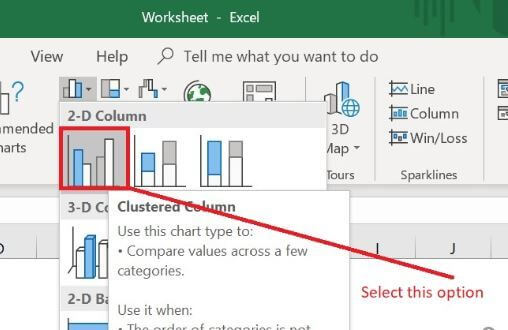
Copy the formula to all the cells to calculate, cumulative % for all the rows. - Select all the data, go to insert menu, click on the charts, select the 2D cluster column bar graph.
- Change the title of the graph or chart.
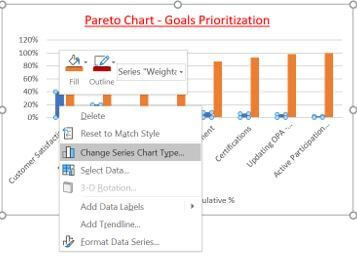
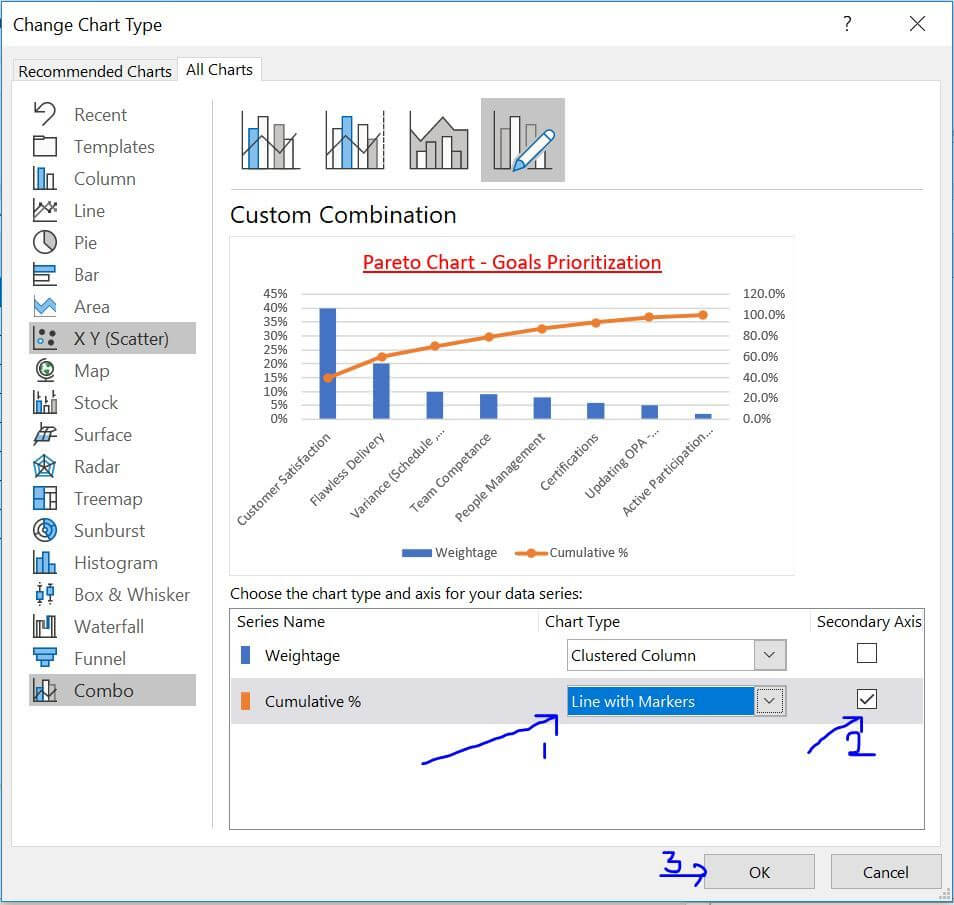
- Change the cumulative % chart type to line graph and add it in another vertical axis.
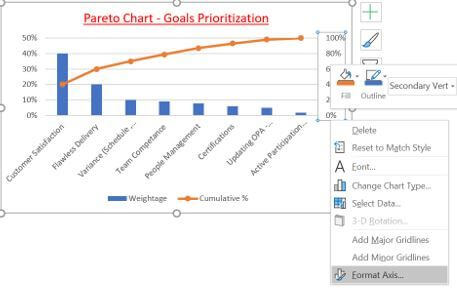
This will create the Pareto chart. - Format the Vertical Axis. Click on the axis and select Format Axis. And set the vales as required.
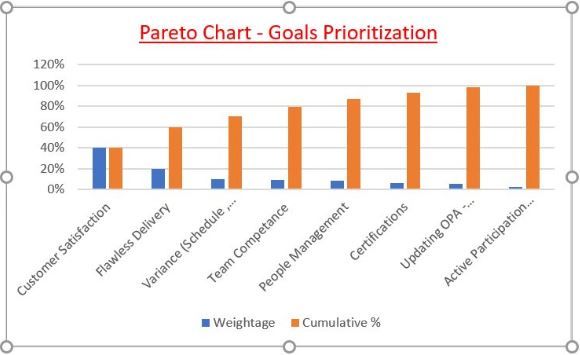
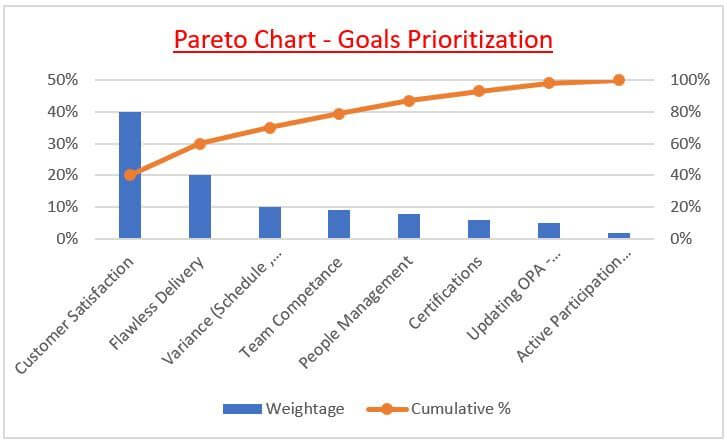
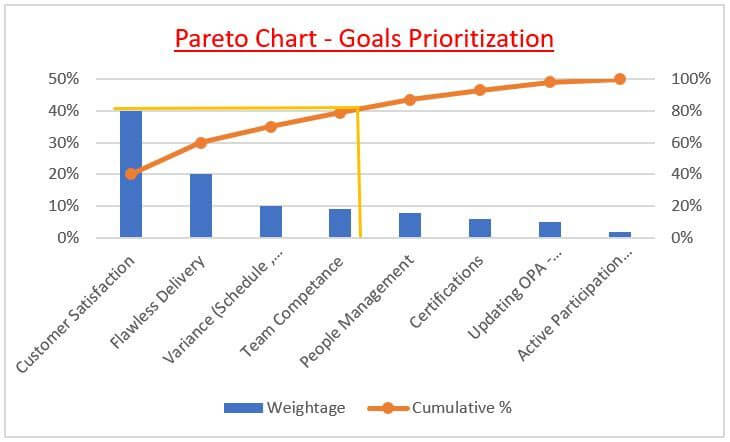
- Following the final Pareto chart.
- If you observe the above Pareto chart, roughly first 4 goals Customer Satisfaction, Flawless delivery, Variance, Team competence will fetch you approximately 80% of the benefit of the total goals.
- Keep the data of goals and weightage for each goal.
Pareto Chart Examples
Here are few more example of Pareto chart.
Pareto Chart Example 1 – House hold expenses
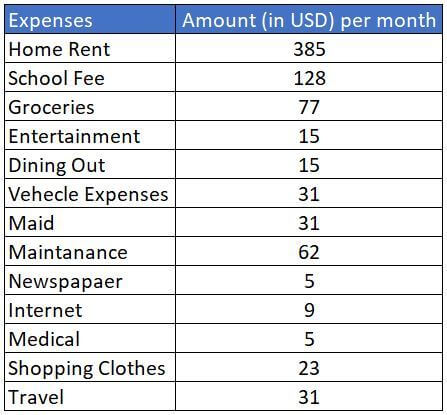
In this example, we take monthly house hold expenses to see what are the big ticketing items, and focus on them to reduce the monthly expenses.
Here is the data that we have which contains house hold expense type and its corresponding monthly expense amount.
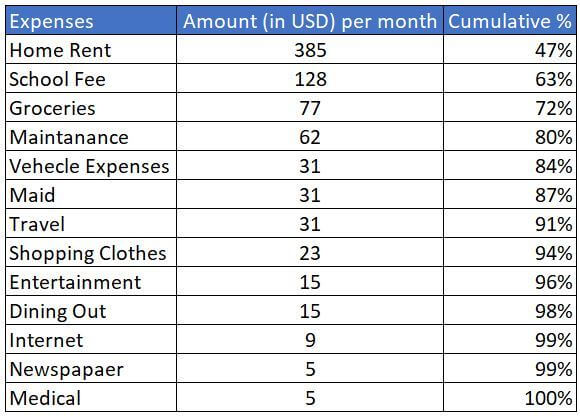
Sorting the amount in descending order and inserting a column to calculate the cumulative % for each row as follows:
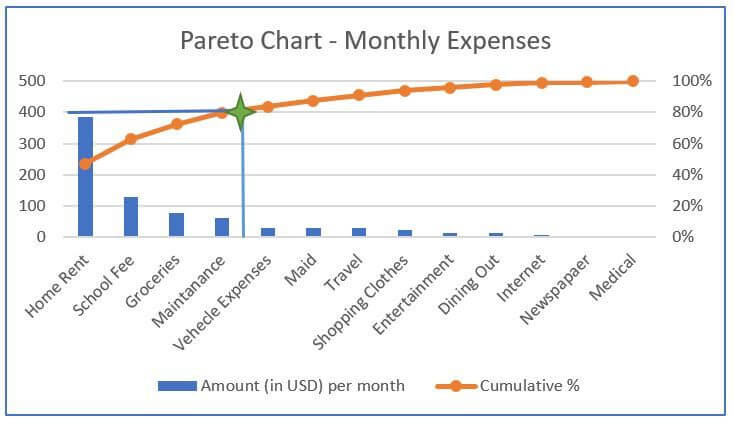
This (above mentioned) is the final Pareto chart of this example.
This concludes that 4 items house rent, school fee, groceries and maintenance are the big ticketing items to focus to reduce the monthly expenses.
Pareto Chart Example 2 – Exam Mistakes
I have explained this 80 20 rule to my kid to see the major mistakes that she needs to consider for improvement in order to quickly improve on her score.
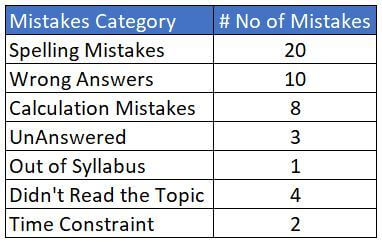
In this example, we tend to take the category of mistakes and the number of similar type of mistakes committed over the period.
Here is the data that we have, which contains Mistakes category and its corresponding number of mistakes per each category.
Sorting the amount in descending order and inserting a column to calculate the cumulative % for each row and the final Pareto chart is as follows:
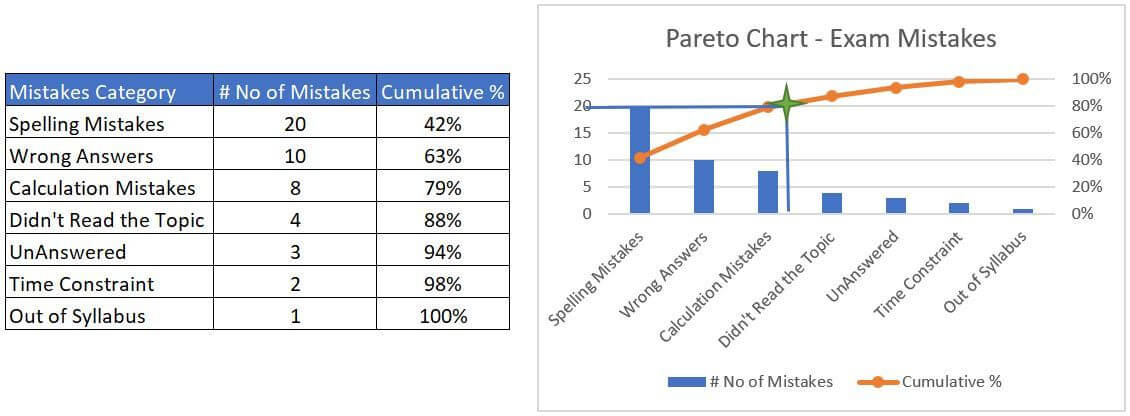
This concludes that 3 items Spelling mistakes, wrong answers, and calculations are the mistakes to focus to improve on the exam score.
What We Have Learned So Far?
Pareto chart is a graphical representation of Pareto analysis or 80 20 rule. It helps to prioritize the most beneficial factors among others.
80 20 rule says that 80% (Trivial Many) of the factors are due to 20% (Vital Few) of causes.
Pareto cart is represented by a combination of bar and line graph.